A sensor that goes offline doesn't give you a warning. It just stops sending data. If your monitoring is configured to alert on "device offline for 15 minutes," you have a 15-minute gap in your data before anyone knows something is wrong. In a quality-sensitive manufacturing environment, that gap can be the difference between catching a process deviation and shipping defective product.
The better approach is to monitor the leading indicators of failure — the signals that predict a sensor is about to fail before it actually does. This article covers what those signals are, how to threshold them for industrial environments, and why high-density metal environments need different monitoring strategies than open-space deployments.
The four health signals that predict failure
1. Signal strength (RSSI) trend, not just current value
Most monitoring systems alert on current RSSI below a threshold — say, alert when RSSI drops below -80 dBm. This works, but it's reactive. A better approach is to track RSSI trend over a 7-day rolling window. A sensor that was at -65 dBm a week ago and is now at -72 dBm isn't in trouble yet, but it's moving in the wrong direction — and if that trend continues, it'll drop off in another two weeks.
In dense industrial environments, RSSI degradation often indicates a physical change near the antenna: new metal shelving installed nearby, a conveyor repositioned, accumulated metal dust on the enclosure. The trend reveals these changes before they cause a failure. A current-value-only threshold misses them.
Practical threshold approach: set a "degrading" state when 7-day RSSI delta exceeds -6 dB, independent of current absolute value. This catches gradual degradation even when the device is still technically above your critical threshold.
2. Heartbeat interval drift
Industrial sensors are typically configured with a fixed heartbeat interval — a periodic uplink that confirms the device is alive and healthy even when there's no sensor event to report. A vibration sensor on a CNC spindle might send a heartbeat every 30 seconds. A temperature sensor in cold storage might send one every 5 minutes.
Heartbeat interval drift — where a device's actual uplink timing begins to deviate from its configured interval — is one of the earliest indicators of firmware instability. A device that was heartbeating every 30 seconds but is now averaging 47 seconds has something wrong with its timer interrupt or its connection management. This symptom often precedes a full disconnect by days.
To detect this, you need to track actual heartbeat timing against expected timing per device, not just "did a heartbeat arrive in the last N minutes." A device that sends a heartbeat every 47 seconds will pass a "heartbeat in last 5 minutes" check indefinitely while clearly exhibiting a health problem.
3. Battery discharge curve deviation
Battery-powered sensors have a predictable discharge curve for their chemistry type and operating load. A new LiPo cell at room temperature in a vibration sensor with 30-second heartbeats will discharge at a fairly consistent rate. Deviations from that curve — specifically, accelerated discharge — indicate either a hardware problem (leaking cell, bad contact) or a firmware problem (higher-than-expected CPU usage from a bug).
Predicting replacement date based on current percentage alone is unreliable. A device at 60% that's discharging at twice the normal rate will hit 0% in half the expected remaining time. Track discharge rate, not just current level. Alert when discharge rate deviates more than 20% from the device's own historical baseline.
4. Uptime percentage over sliding windows
A single offline event doesn't tell you much — it could be a scheduled maintenance shutdown, a one-time power interruption, or a transient network issue. Uptime percentage over 30 days tells you about reliability patterns. A device at 94% uptime over 30 days is experiencing roughly 1.7 hours of unplanned downtime per week — which may be acceptable or may indicate an intermittent problem worth investigating.
More informative: track uptime correlated with firmware version. If a device's 30-day uptime drops from 99.2% to 95.8% after a firmware update, that's a causal signal. If uptime is degrading across all devices in a zone after you replaced network infrastructure, that's an environmental signal. Correlation enables root cause analysis that current-state monitoring can't provide.
Why high-density metal environments need different thresholds
Open-space deployments — a warehouse with wide aisles, for example — have relatively predictable RF behavior. An access point at one end of the building provides fairly even coverage with a distance-based RSSI gradient. You can set one RSSI threshold for the whole facility and it will be meaningful.
Dense metal environments are different. A CNC machining floor with steel machines every 2 meters, overhead metal tracks, vibrating metal enclosures, and high-power electrical equipment creates RF conditions that vary dramatically from one sensor position to the next — and that change based on what's running. A sensor on the same machine as a running spindle motor experiences different interference than when the spindle is stopped.
What this means for threshold configuration:
- Per-group thresholds, not fleet-wide. A sensor on Line 3 near the power distribution panel has a permanently lower RSSI than a sensor on Line 1 near a window. A fleet-wide -80 dBm threshold will fire constantly on the power-panel sensor and may be too loose for the Line 1 sensor. Configure thresholds at the fleet group level to match each zone's ambient conditions.
- Baseline each sensor individually. During the first week of deployment, record each sensor's typical RSSI, heartbeat variance, and battery discharge rate. Use these device-specific baselines as the comparison point for anomaly detection, not a generic target value.
- Suppress alerts during known interference periods. If your facility runs a high-current welding operation every Tuesday from 10am–12pm that degrades Wi-Fi across the building, schedule an alert suppression window during that period. Otherwise, every Tuesday generates 200 false-positive signal alerts that operators learn to ignore — including legitimate alerts that arrive during the same window.
The heatmap as an operational tool
Individual per-device metrics are useful for diagnosing specific problems. A heatmap of signal quality across a fleet group's physical layout is useful for operational pattern recognition.
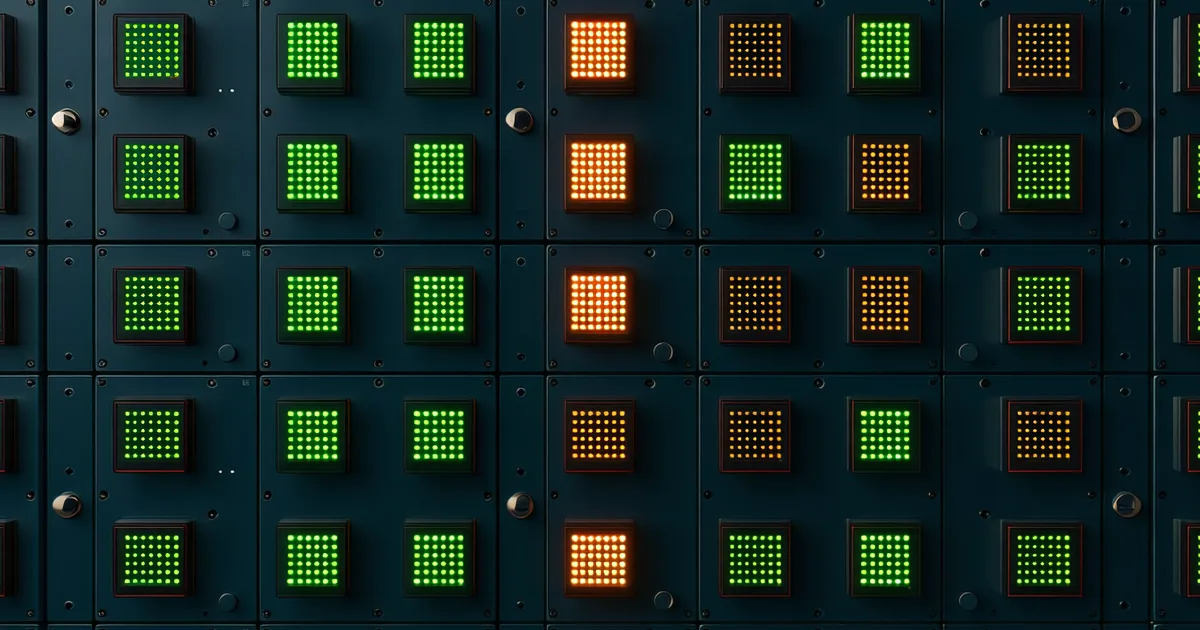
A heatmap showing three sensors in amber in the northeast corner of Assembly Floor B, arranged in a rough triangle, immediately suggests a single RF dead zone — probably a metal obstruction or a gap in access point coverage. The same three amber sensors in a per-device list might not reveal the spatial pattern at all.
The heatmap is most valuable when you can overlay it on a floor-plan grid. Even a rough grid — 8 columns by 6 rows representing physical zones — transforms a list of signal quality readings into a spatial problem-finding tool. Maintenance teams can go directly to the zone showing the dead spot and investigate.
For 30-day trend views, the heatmap should be animatable or at least comparable: "here's today's map versus 30 days ago." Zones that are gradually yellowing from green indicate infrastructure changes in that area. Zones that flip suddenly from green to red indicate equipment additions or changes.
Battery monitoring at fleet scale
For a fleet of 500+ battery-powered sensors, individual battery notifications aren't operationally useful. Getting an alert that device LA-0047 is at 15% battery is fine — but if you're also getting that alert for LA-0051, LA-0063, LA-0091, and LA-0104, you need a maintenance run, not five individual alerts.
Fleet-level battery management is about scheduling maintenance runs efficiently:
- Group devices by predicted replacement date into cohorts — "need replacement in next 30 days," "30–90 days," "90+ days."
- Generate a replacement work order when the 30-day cohort exceeds a threshold (e.g., 15 devices) — not one alert per device.
- Track which zones have the highest battery turnover rate — this may indicate zones with higher sensor activity, harder operating conditions, or devices from a batch with manufacturing variance.
The goal is to turn battery management from reactive (alert when low) into planned maintenance scheduling — which reduces both the cost and disruption of battery replacement on the floor.
Connectivity gap detection: distinguishing expected from unexpected
Not all connectivity gaps are problems. Sensors go offline during planned maintenance shutdowns. Facilities run weekly line stops for cleaning. If your monitoring doesn't distinguish expected offline periods from unexpected ones, your alert history is full of noise.
The mechanism: mark any period where the facility has a scheduled maintenance event as "planned downtime" in the monitoring system. Connectivity gaps during planned downtime don't generate alerts and don't count against uptime percentage. Connectivity gaps outside planned downtime windows are tracked as anomalies.
The more sophisticated version: correlate connectivity gap timing with operational events. If Line 3 always shows connectivity dips from 6–6:15am, that likely corresponds to the shift start sequence — machines powering on, creating RF interference. That's not a sensor problem. But if those dips start lasting until 7:30am, something has changed and it warrants investigation.
What to monitor vs. what to alert on
Not every monitored metric needs an immediate alert. A useful framework:
- Alert now (critical): Sensor offline for longer than expected gap time. Heartbeat interval deviation greater than 50% from baseline for two consecutive hours. Battery below 10%.
- Alert in next shift (warning): RSSI degrading trend over 7 days. Battery discharge rate accelerating beyond baseline. Uptime below 95% over 7 days.
- Weekly digest only (informational): Devices with 30–60 day predicted battery replacement. Devices running below fleet firmware baseline. Devices that haven't heartbeated in the expected window but came back within 5 minutes.
The goal is that when a floor engineer looks at their monitoring dashboard during a shift, they see a manageable set of real issues, not a feed of 200 notifications that range from "conveyor briefly rattled a sensor enclosure" to "sensor has been offline for 4 hours." Alert severity should correspond to actual urgency, not just "something changed."
The monitoring setup that's actually maintainable
Threshold tuning is ongoing work, not a one-time configuration. Expect to review and adjust thresholds after major operational changes: new production lines, retooled zones, firmware updates, seasonal temperature changes in facilities without climate control.
The most common mistake is setting thresholds once at deployment and never revisiting them. After six months, the thresholds are wrong for the facility as it exists now, and the ops team has learned to ignore the noise they generate.
A quarterly threshold review — checking which alerts are being acknowledged quickly vs. which are being routinely ignored — keeps the monitoring system calibrated to how the floor actually operates.